
State of Maintenance 2026
8 chapters, 12 global regions, 100+ data points. The most comprehensive industry research on maintenance management, including the uncomfortable truths most reports won't tell you.
Download Free Report
Get instant access to the full 30-page report
Deep-Dive Research Coverage
From the $1.4 trillion downtime crisis to implementation realities: every aspect of modern maintenance management.
The Downtime Crisis
$1.4T problem, industry costs, ROI analysis
Workforce Transformation
69% aging workforce, 1.7M skills gap
Technology Adoption
Cloud, AI, IoT, mobile CMMS trends
Global Market Analysis
12 regions, market sizing, CAGR projections
Industry Verticals
11 verticals: Healthcare to Data Centers to Waste Mgmt
High Performer Practices
What top facilities teams do differently
Implementation Realities
60-80% failure rates, true costs, risks
The Road Ahead
2026-2030 predictions and recommendations
12 Regions Analyzed
Market sizing, growth projections, and regional trends across Asia-Pacific, EMEA, and the Americas.
What You'll Learn
Data-driven insights with full source citations, plus appendices with data tables and glossary.
Who Should Read This Report
Whether you're making budget decisions or managing daily operations, find the chapters most relevant to your role.
C-Suite & Budget Holders
ROI justification, implementation risks, and strategic roadmap for technology investment decisions.
→ Chapters 1, 7, 8
Operations & FM Managers
Downtime benchmarks, high-performer practices, and 2019-2026 industry evolution context.
→ Chapters 1, 6, How We Got Here
IT & Systems Integrators
Technology market trends, IT vs Operations dynamics, and IoT cost democratization data.
→ Chapter 3, How We Got Here
Maintenance Technicians
Workforce trends, skills gap reality, and what high-performing teams do differently.
→ Chapters 2, 6
Investors & Analysts
Global market sizing, regional CAGRs, and comprehensive data tables in appendices.
→ Chapter 4, Appendix A
Consultants & Vendors
Industry vertical insights, implementation success factors, and vendor selection pitfalls.
→ Chapters 5, 7
Industry-Specific Insights
Comprehensive analysis across 11 industry verticals with benchmarks, challenges, and technology recommendations.

Healthcare
Critical equipment uptime, regulatory compliance, infection control

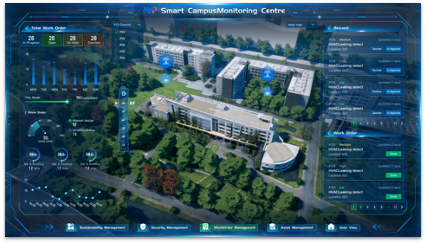
Education
Campus-wide asset tracking, compliance, deferred maintenance backlog
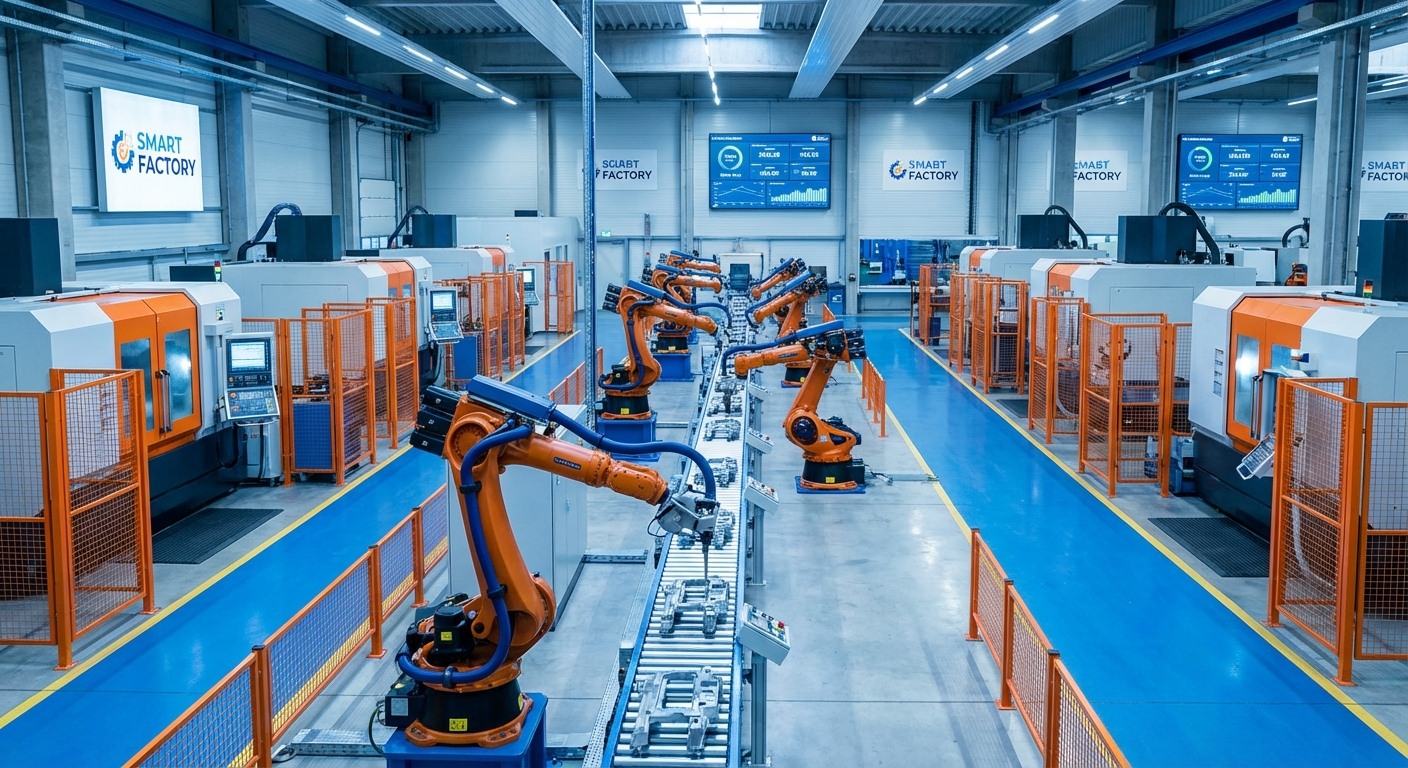
Manufacturing
Production line uptime, predictive maintenance, OEE optimization

Hospitality
Guest experience, multi-property management, rapid response
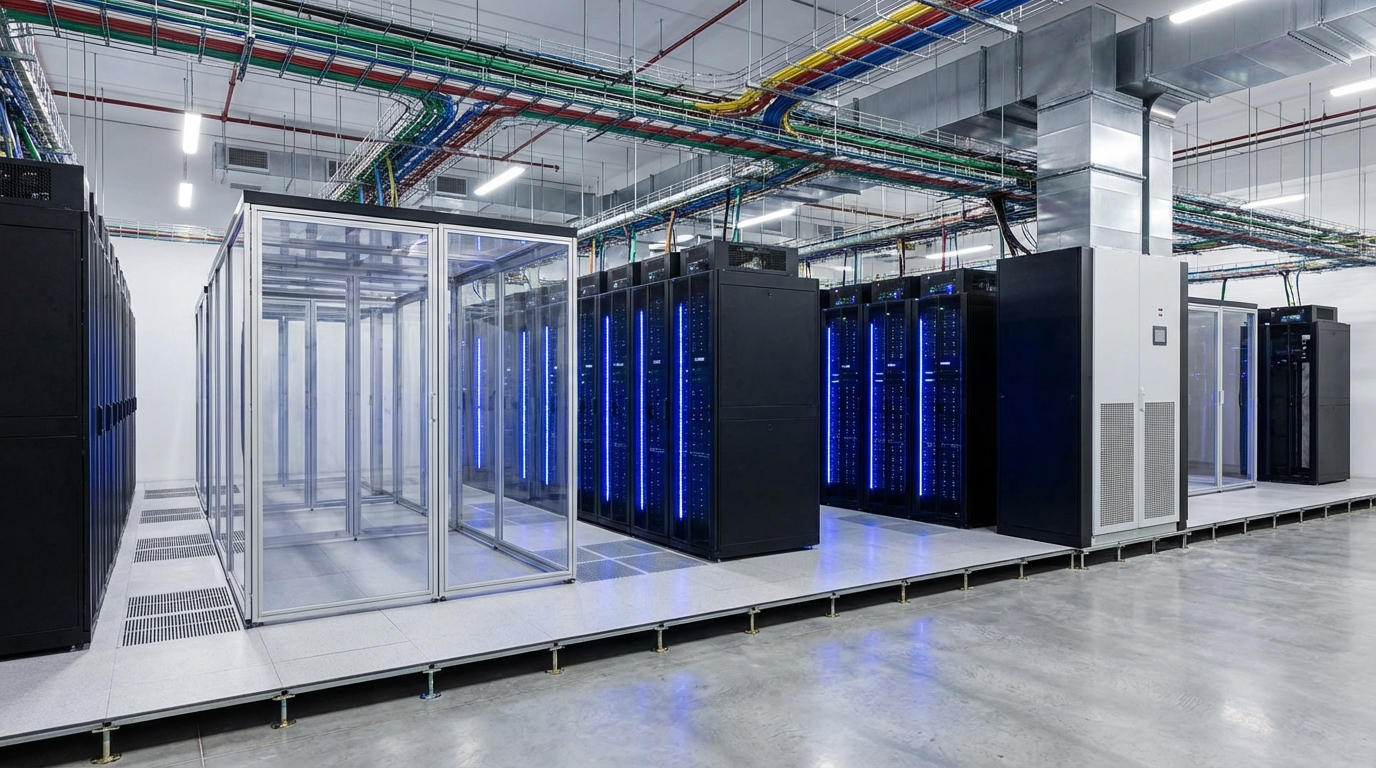
Data Centers
99.99% uptime SLAs, $300K-$1M/hour downtime, Tier certification

Commercial RE
Tenant satisfaction, portfolio management, ESG reporting

Government
$370B deferred maintenance backlog, compliance, public safety

Food & Beverage
FDA/HACCP compliance, cold chain monitoring, food safety

Retail
64% customer loss from poor conditions, multi-site management

Property Mgmt
7-23 requests/unit annually, tenant satisfaction, turnover costs

Waste Mgmt
Fleet maintenance, EPA compliance, smart bin adoption
The Numbers That Matter
Executive-level visualizations from our comprehensive industry research.
The Trillion-Dollar Downtime Crisis
Fortune 500 unplanned downtime cost
Fortune 500 companies now lose $1.4 trillion annually to unplanned downtime, a 62% increase from 2019.
Annual ROI from CMMS
Mid-size facility (250+ assets)
Downtime
Efficiency
Savings
Cost
ROI
Source: Industry benchmarks
Industry Downtime Impact Analysis
Hourly downtime cost by sector with year-over-year trends
Key Finding: Automotive leads with $2.3M/hour losses, reflecting just-in-time manufacturing vulnerabilities. Meanwhile, education sector shows 12% YoY improvement driven by preventive maintenance adoption.
| Industry | Cost/Hour | Relative Impact | Severity | YoY Change |
|---|---|---|---|---|
| Automotive Just-in-time manufacturing | $2.3M per hour | $2.3M/hr | CRITICAL | +23% |
| Data Centers 99.99% SLA requirements | $1.0M per hour | $1.0M/hr | HIGH | +18% |
| Healthcare Incl. regulatory penalties | $5.0M+ per hour | $5.0M+ | CRITICAL | +15% |
| General Manufacturing Production line downtime | $260K per hour | $260K | MEDIUM | +8% |
Key Findings Preview
A glimpse of the data-driven insights inside this comprehensive industry report.
The $1.4 Trillion Problem
Fortune 500 companies now lose $1.4 trillion annually to unplanned downtime, up from $864B just five years ago.
The Workforce Cliff
69% of maintenance professionals are 50+ years old. The US faces a 1.7 million annual shortfall in skilled trades workers.
AI Adoption Surge
Only 32% of teams have implemented AI today, but 65% plan to adopt by end of 2026. Early adopters report 75% reduction in downtime.
Frequently Asked Questions
What is the cost of unplanned equipment downtime?
Fortune 500 companies lose $1.4 trillion annually to unplanned downtime, a 62% increase since 2019. Costs vary dramatically by industry: automotive manufacturing averages $2.3 million per hour, data centers $1.0 million per hour, and healthcare $5.0 million+ (including regulatory penalties). SMBs typically experience $427 per minute in downtime costs.
Why do 60-80% of CMMS implementations fail?
60-80% of CMMS implementations fail due to change management issues, not technology problems. The primary causes include: poor user adoption (70% of failures), where technicians resist new systems when training is inadequate; inadequate change management (42%), where organizations underestimate the organizational dynamics; and inexperienced implementation teams (35%), where first-time CMMS buyers lack deployment expertise. Success requires treating CMMS as a people project, not just a software purchase.
How serious is the maintenance technician shortage?
The maintenance workforce crisis is severe: 69% of maintenance professionals are 50+ years old, with 40% of manufacturing workforce retiring by 2030. The US faces a 1.7 million annual shortfall in skilled trades workers. For every machinist retiring, there are 2.4 openings but only one qualified graduate. This means organizations must do more with fewer people, making technology-driven productivity gains essential.
How much do IoT sensors cost for condition monitoring?
IoT sensor costs have dropped dramatically: from $500-2,000+ per monitoring point (pre-2020) to $25-100 today for mature LoRaWAN-based systems. This 80-95% cost reduction makes predictive maintenance economically viable for facilities that were previously "too small" for traditional building automation systems. The LoRaWAN market is growing at 41% annually, with even Honeywell now offering LoRaWAN hubs.
Which region has the fastest CMMS market growth?
Asia-Pacific leads at 12-14% CAGR, the fastest-growing CMMS market globally. Southeast Asia's facilities management market is projected to grow from $85 billion (2024) to $119 billion by 2030. Growth is driven by industrialization, government initiatives like Thailand 4.0, and rapid IoT adoption in manufacturing. Singapore's Progressive Wage Model also mandates 5.7% annual wage increases for cleaning/security workers, pushing organizations toward technology-driven efficiency.
Explore Related Resources
Dive deeper into CMMS technology and maintenance best practices
Infodeck CMMS Platform
Explore the features mentioned in this report: IoT integration, mobile-first design, and AI-powered insights.
View platformWork Order Management
Automate routing, track progress, and reduce the downtime costs discussed in Chapter 1.
Learn morePricing & Plans
See how Infodeck compares to the CMMS costs discussed in Chapter 7's implementation analysis.
View pricingResearch Methodology
How we compiled this report
Primary Research Analysis
Review of original industry surveys from IFMA, BOMA, and AFE professional associations.
Market Intelligence
Data from Grand View Research, Mordor Intelligence, MarketsandMarkets, and Verdantix.
Government & Regulatory
US Bureau of Labor Statistics, Singapore MOM, OSHA, EU regulatory frameworks.
Industry Reports
Splunk 2025 Downtime Study, Siemens Smart Infrastructure, Deloitte, and McKinsey analysis.
Full citations included: All 100+ statistics include source references in the complete report. No vendor-sponsored research or marketing claims, just honest, verifiable data.
Ready to Transform Your Maintenance Operations?
Join the facilities teams achieving 75% less unplanned downtime. Start your free 30-day trial today.